If you travel, work, or run a business in Lagos, transport data can help you make better choices. It can show when a route slows down, how fares change, and whether a service runs as planned. But a useful monthly report needs clear definitions. A daily estimate, a cumulative passenger total, and a monthly count are different things.
Use the seven metrics below as a practical dashboard framework. They’re indicators to track, not a claim that complete monthly figures are already published for every Lagos transport mode. Keep each number tied to its route, service, reporting period, and source.
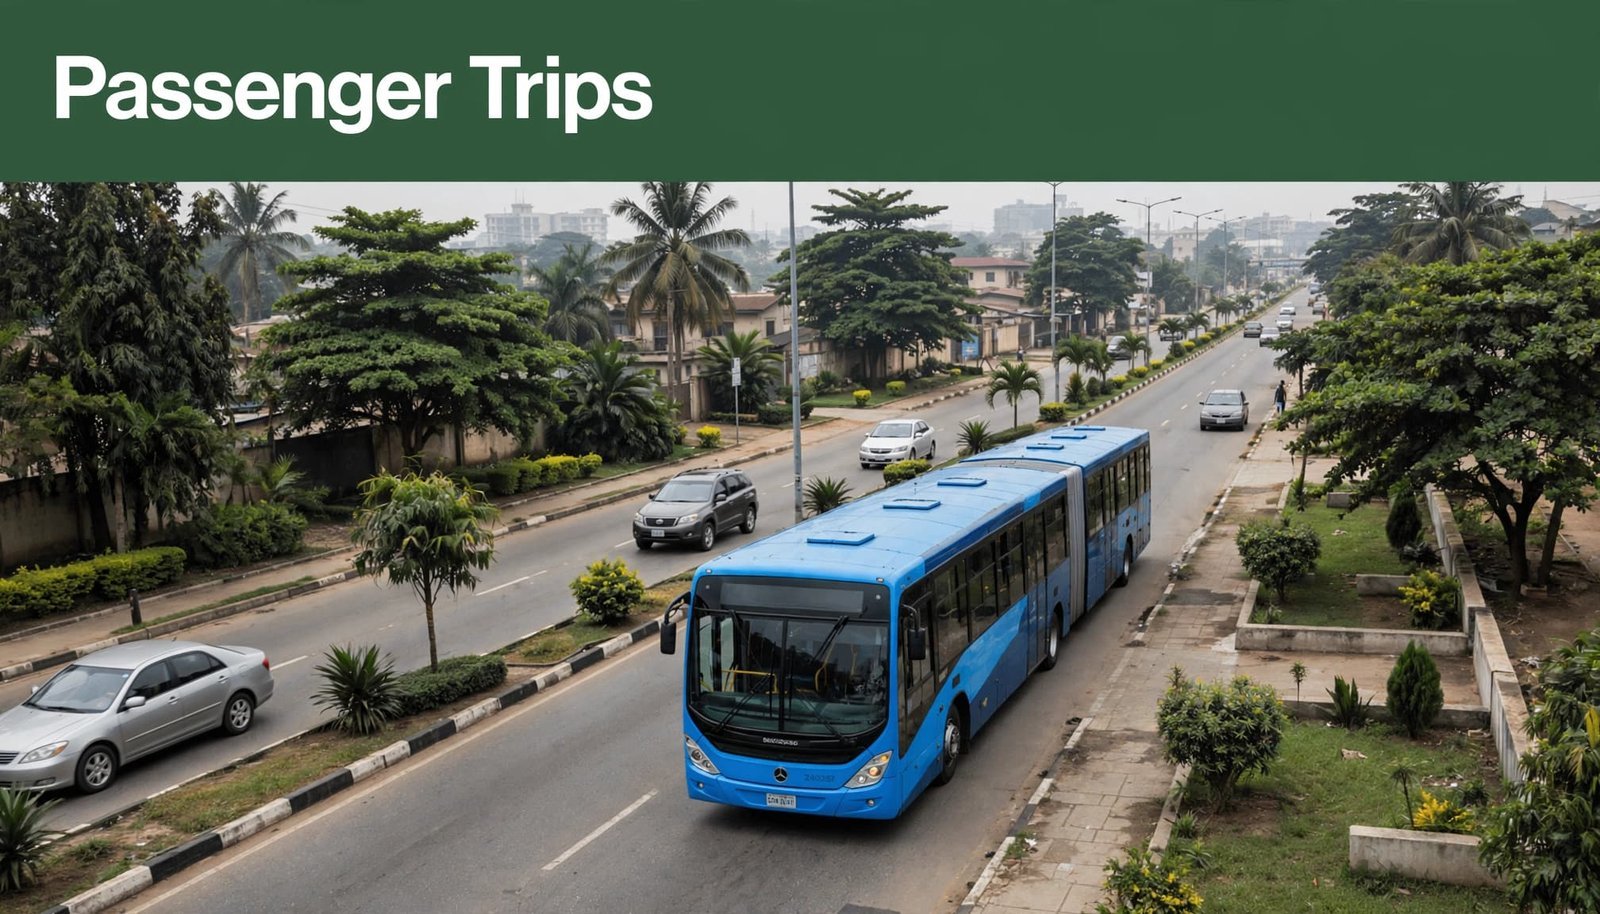
1. Monthly passenger trips
Count the number of passenger boardings recorded during the month, then separate the total by mode, operator, and route. BRT, standard buses, rail, ferries, danfo, and ride-hailing shouldn’t be combined unless you have a clear method for gathering comparable data from each service.
Decide whether your figure counts boardings or complete journeys. A passenger who changes buses may create two boardings but make one journey. If you mix those definitions, your total can look higher or lower without any real change in travel demand. Track the number of days the service operated, too, so you can compare a full month with one affected by closures or fewer operating days.
LAMATA’s website describes close to 20 million trips a day across Lagos. Treat that as a broad daily estimate, not a verified monthly count or a mode-by-mode dataset. Your dashboard should label the figure’s period and source clearly, rather than multiplying it by the number of days in a month and presenting the result as observed data.
2. Monthly service frequency
Track the number of trips each operator schedules and the number it actually runs. A published timetable tells you what should happen. Dispatch logs, vehicle records, or other operator data can show what happened. Keep the two figures separate.
You can report completed trips per day and the total for the month. Include the service’s operating days and any planned schedule changes. For example, a service that runs fewer trips on Sundays shouldn’t be compared with a weekday schedule as if both days were the same.
Don’t treat added trips as proof of higher passenger use. LAMATA has reported that the Red Line increased from six daily trips to nine daily trips from February 2025. That describes service frequency, not monthly ridership. The difference matters when you’re using data to judge demand or service performance.
3. Travel time by route and time of day
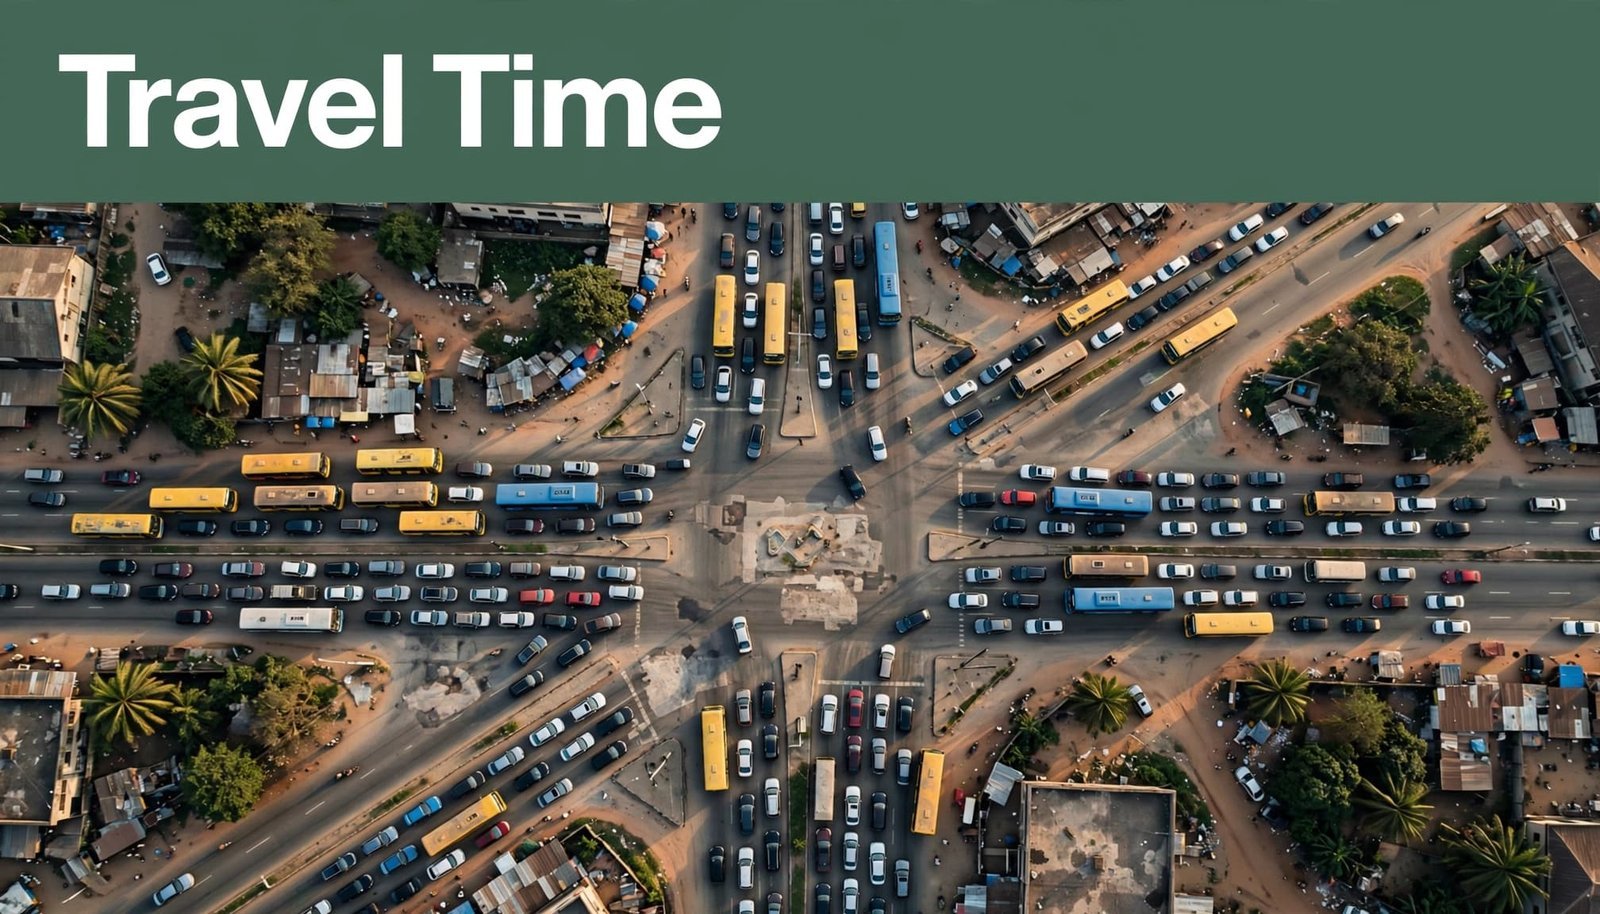
Measure travel time on a defined route, in a defined direction, during a defined time window. A trip from Ikeja to CMS at 8 a.m. is not directly comparable with the same route at noon. Track rush-hour and off-peak journeys separately, and identify whether the figure covers only the ride or also includes waiting and transfers.
Use the median travel time to show a typical trip, and consider tracking the 90th percentile to show how long a slower journey can take. One average can hide the days when traffic, rain, flooding, or a road incident causes a major delay. Record the dates and conditions that affect your data, rather than treating every month as a normal one.
A route’s usefulness also depends on where you board and where you need to go after you get off. A BRT or rail leg may avoid some road traffic, but your full trip can still include a feeder bus, a queue, or a walk to your destination. For a wider look at how different modes fit together, use this Lagos public transportation guide. LAMATA’s Lagos Urban Transport Master Plan provides planning context, but it shouldn’t be mistaken for a current monthly travel-time dataset.
4. Service reliability
Measure how often a service runs close to its published schedule. For buses, rail, or ferries, you might track the percentage of scheduled trips that depart within a set time window. For a service that runs at regular intervals, you can track the gap between vehicles and compare it with the planned headway.
Choose your definition before collecting data. For example, a team could define an on-time departure as one that leaves no more than five minutes after its scheduled time. That threshold is a reporting choice, not a universal standard. Keep the same rule each month, and publish it alongside the result.
Record cancellations, missed trips, late starts, and long waits separately. A single “reliability score” can hide the reason a passenger had a poor trip. When you compare services, name the route, time period, and data source. A passenger’s experience at one stop may not represent the full service.
5. Fare changes and the cost of a full trip
Track what passengers pay for a consistent set of journeys. Choose routes with clear starting and ending points, then record the applicable fare, service type, and date. For a fuller picture, include transfers and the cost of reaching the terminal or final destination. A published BRT fare is only one part of the total cost if your journey needs another bus or a taxi.
Keep regulated fares separate from informal bus, taxi, and ride-hailing prices. Those services use different pricing methods. A ride-hailing quote can change with traffic, time, or demand; an informal fare may vary by route conditions or vehicle availability. Record how each amount was obtained, such as a dated fare table, a live app quote, or a fare confirmed before boarding.
Lagos bus fares increased by 13% on March 2, 2026, according to the information provided for this article. Treat that as a dated fare change, not a guarantee of the current price. Check the current Lagos bus fare guide and confirm the applicable fare with the operator before you travel. Keep fare comparisons tied to the same route and service type, so a change in the journey doesn’t look like a fare increase.
6. Transport mode share
Mode share shows how people divide their trips among transport options. To calculate it, divide the number of trips made by one mode by the total trips in the same survey or dataset, then multiply by 100. State what counts as a trip, which areas and routes were covered, and how people were counted.
Monthly mode-share data requires regular, comparable surveys or a reliable source of passenger counts across modes. A bus operator’s monthly boardings alone won’t tell you the share of all Lagos journeys made by bus. You need a consistent total-trip estimate that also covers other relevant modes, including walking where the survey measures it.
LAMATA’s historical modal-split figures are from 2015. They can help you understand that Lagos travel has long included a mix of walking, minibuses, private vehicles, buses, rail, and water transport, but they aren’t a current monthly breakdown. Don’t use an old citywide snapshot as this month’s mode share.

Water transport also needs its own coverage notes. LAGFERRY has reported cumulative passenger and network figures, but cumulative totals don’t show how many people used a route in a specific month. LAMATA’s water transport assessment can support background research on water transport, but it isn’t a substitute for current monthly passenger counts. For route and boarding-point context, see the guide to Lagos ferry routes and terminals.
7. Safety incidents and service disruptions
Record reported safety incidents and major disruptions by date, location, route, and mode. Separate events such as collisions, injuries, flooding, route closures, ferry cancellations, and equipment problems. A clear category list helps you compare reports from one month to the next.
Raw counts can mislead when service levels change. If you have reliable passenger totals, report incidents per 100,000 passenger trips as well as the total number of incidents. If you don’t have passenger data, say so and show the raw count only. Don’t imply that a month was safer simply because fewer people used the service.
Keep confirmed incidents separate from unverified reports. Note the source and whether the figure comes from an operator, a public agency, or a passenger report. A transport dashboard is more useful when readers can tell what was observed, what was reported, and what remains unconfirmed.
How to compare Lagos transport data month by month
Give every data point a small set of labels: reporting month, route or corridor, mode, operator, unit, source, and collection method. Add a note when a value is estimated, sampled, or incomplete. This makes it easier for you to spot gaps and stops readers from mistaking one type of figure for another.
Use the same definitions each month. If you change the routes in a survey or redefine what counts as an on-time departure, explain the change. Otherwise, an apparent improvement or drop may come from a new method rather than a real change in transport conditions.
Keep three types of information distinct:
- Monthly observations are values counted or measured during a specific month.
- Daily figures describe one day or an average day. They aren’t monthly totals.
- Cumulative figures add up activity over a period, often since a service began. They don’t reveal the result for a single month.
A historical report can still help you understand how transport in Lagos has changed. The Lagos State Ministry of Economic Planning and Budget’s Transport Statistics 2019, for example, includes historical series through 2018. Label that material by its publication period and don’t present it as a current monthly release.
Conclusion
A useful Lagos transport dashboard starts with honest labels and consistent methods. Track passenger boardings, service frequency, travel time, reliability, fares, mode share, and safety or disruption reports, but don’t fill missing months with estimates that look like measured facts. When you compare a route or choose how to travel, check the date, mode, and source behind every number.



Leave a Reply