Lagos transport data can help you see where demand is growing, which services are running reliably, and how much a trip costs to deliver. You don’t need a citywide database to start. You do need clear definitions, consistent monthly reporting, and an honest account of what your data covers.
That last point matters. A count from one operator, route, or terminal is useful, but it isn’t automatically a count for all of Lagos. Use these seven monthly metrics to build a practical picture of transport performance without overstating what the numbers show.
1. Passenger Boardings by Route and Mode
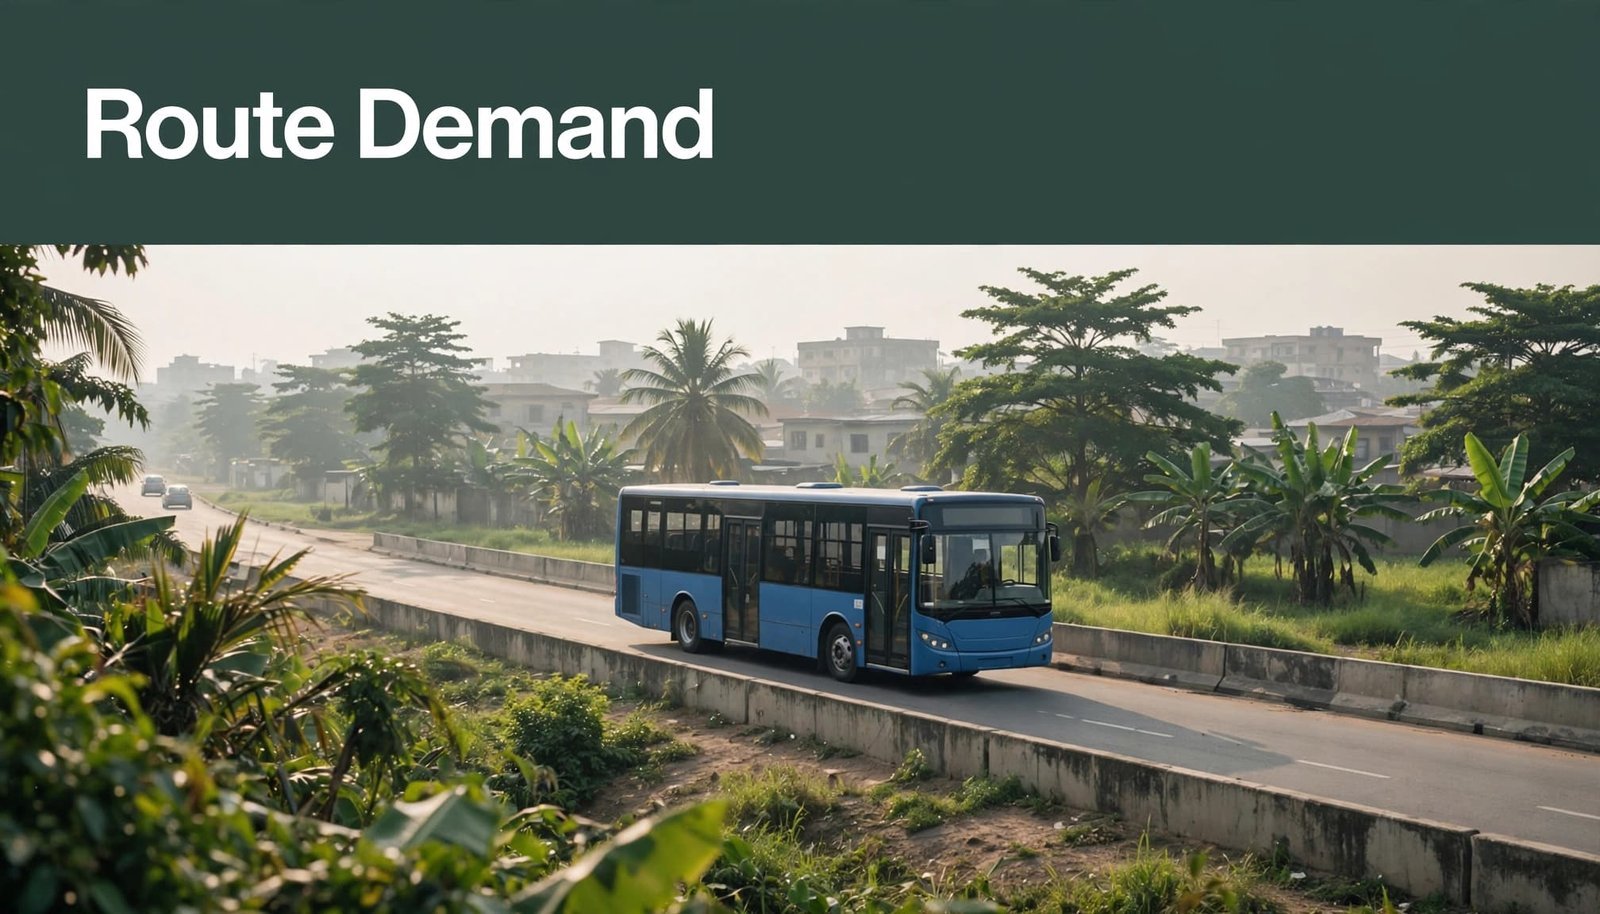
Count passenger boardings for each route and transport mode, then compare the results with previous months. Keep BRT, standard buses, danfo, rail, ferry, and ride-hailing data separate unless you have a sound way to combine them. A trip that uses a bus and then a ferry may create two boardings, but it is still one passenger journey.
Write down what each count means. A boarding, a ticket validation, a passenger, and a complete journey are different units. If an operator records Cowry taps, for example, say that you are reporting validations, not unique passengers, unless your data can identify individual travelers without double-counting.
Break the figures down by route, direction, and day type where possible. This helps you spot changes that a monthly total can hide, such as heavier weekday demand on one corridor or a fall in weekend travel. Compare like with like: a month with extra operating days or a major public holiday may need context before you call it a trend.
LAMATA reports include historical passenger figures for specific services, but those figures have defined scope and reporting periods. Treat them as service-level evidence, not a current total for every Lagos passenger. For route context, see the Lagos BRT routes and fares guide.
2. Service Delivered Versus Scheduled
Track how many trips were planned and how many actually ran. You can report the number of completed departures, canceled trips, and trips that left service early. Keep the measure consistent across operators, because one company may record a trip as complete when it reaches the terminal while another may count only trips that follow the full route.
A simple monthly delivery rate is:
Completed trips ÷ scheduled trips × 100
This gives you a clear view of service delivery, but the result needs a time period and a service boundary. State whether the count covers weekdays, weekends, one route, or an entire operator network. If the schedule changed during the month, keep the old and new periods distinct or explain how you handled the change.
You can pair this metric with a short note on why trips were missed. Vehicle breakdowns, staff shortages, road closures, flooding, and low passenger demand can affect service for different reasons. Avoid combining them into one vague category if the operator can identify the cause.
For passenger-facing context, compare the recorded trips with the published timetable or operator information. Lagos has several transport systems with different schedules and operating rules, so don’t apply one service standard to every bus, ferry, or rail line. The Lagos bus schedules guide explains why the operator and exact service matter when you plan a trip.
3. On-Time Performance and Corridor Travel Time
Measure how often trips leave or arrive within a set time window. Choose the rule before you collect the data. For example, you might define an on-time arrival as one that reaches its destination no more than a set number of minutes after the scheduled time. Report that threshold with the result so readers can interpret it correctly.
Track both departure and arrival performance when you can. A bus may leave on time and arrive late because of traffic, while a ferry may depart late due to boarding or weather conditions. Keep each mode’s result separate, and record the route, date, time of day, and sample size.
For road corridors, calculate median travel time as well as an average. A few very long delays can pull the average upward, while a median gives you a better sense of the middle trip. Compare the same origin, destination, and time window each month. A morning trip and an evening trip on the same road aren’t directly comparable.
Lagos transport sources don’t establish a single, routinely published monthly travel-time series for every corridor. If you use GPS data, field observations, or operator logs, state how many trips you sampled and how the routes were chosen. LAMATA’s Lagos Urban Transport Master Plan offers wider transport-planning context, but it doesn’t replace your own clearly defined monthly sample.
4. Passenger Load and Capacity Use
Passenger volume tells you how many boardings were recorded. Load factor tells you how that demand compares with the service’s passenger capacity. A basic calculation is:
Passenger boardings or observed passengers ÷ available passenger capacity × 100
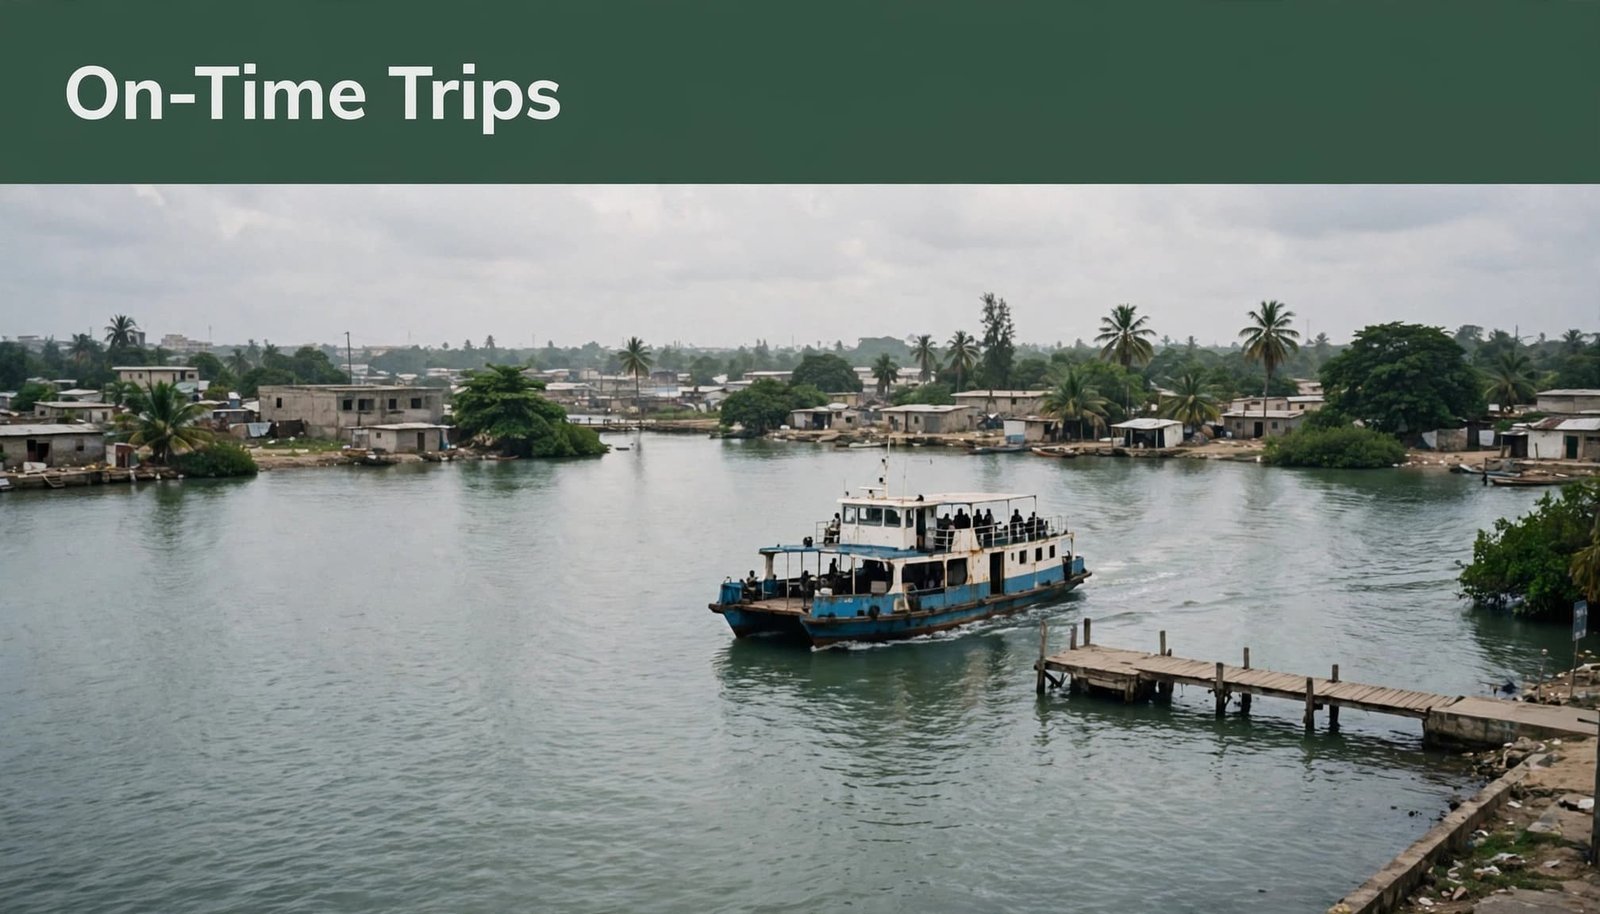
Choose the right unit for the mode. On a bus, you may be able to compare passenger counts with rated capacity at selected points along a route. For ferries, use the vessel’s approved passenger capacity and count passengers on the relevant sailing. Don’t use the maximum capacity of a vehicle if it wasn’t available for the full trip.
The timing of your sample matters. A count taken during the morning peak may show a packed service, while a midday count may show spare capacity. Record the route segment, direction, and time of observation. If you only measured a few trips, label the result as a sample rather than a full-month network figure.
This metric can help operators and planners decide whether to add trips, adjust vehicle size, or review service frequency. It can also reveal a mismatch: crowded trips in one direction alongside lightly used return services. Don’t treat a high load factor as proof that the service is working well. Long waits, missed trips, and unsafe crowding can all sit behind a strong passenger count.
For ferry data, use a route and terminal definition that matches the service being counted. The Lagos ferry routes and terminals guide can help readers understand why a jetty and landing point need to be identified, not just the general area.
5. Cost per Passenger Trip
Track the operating cost of a service and divide it by the passenger trips delivered during the same period:
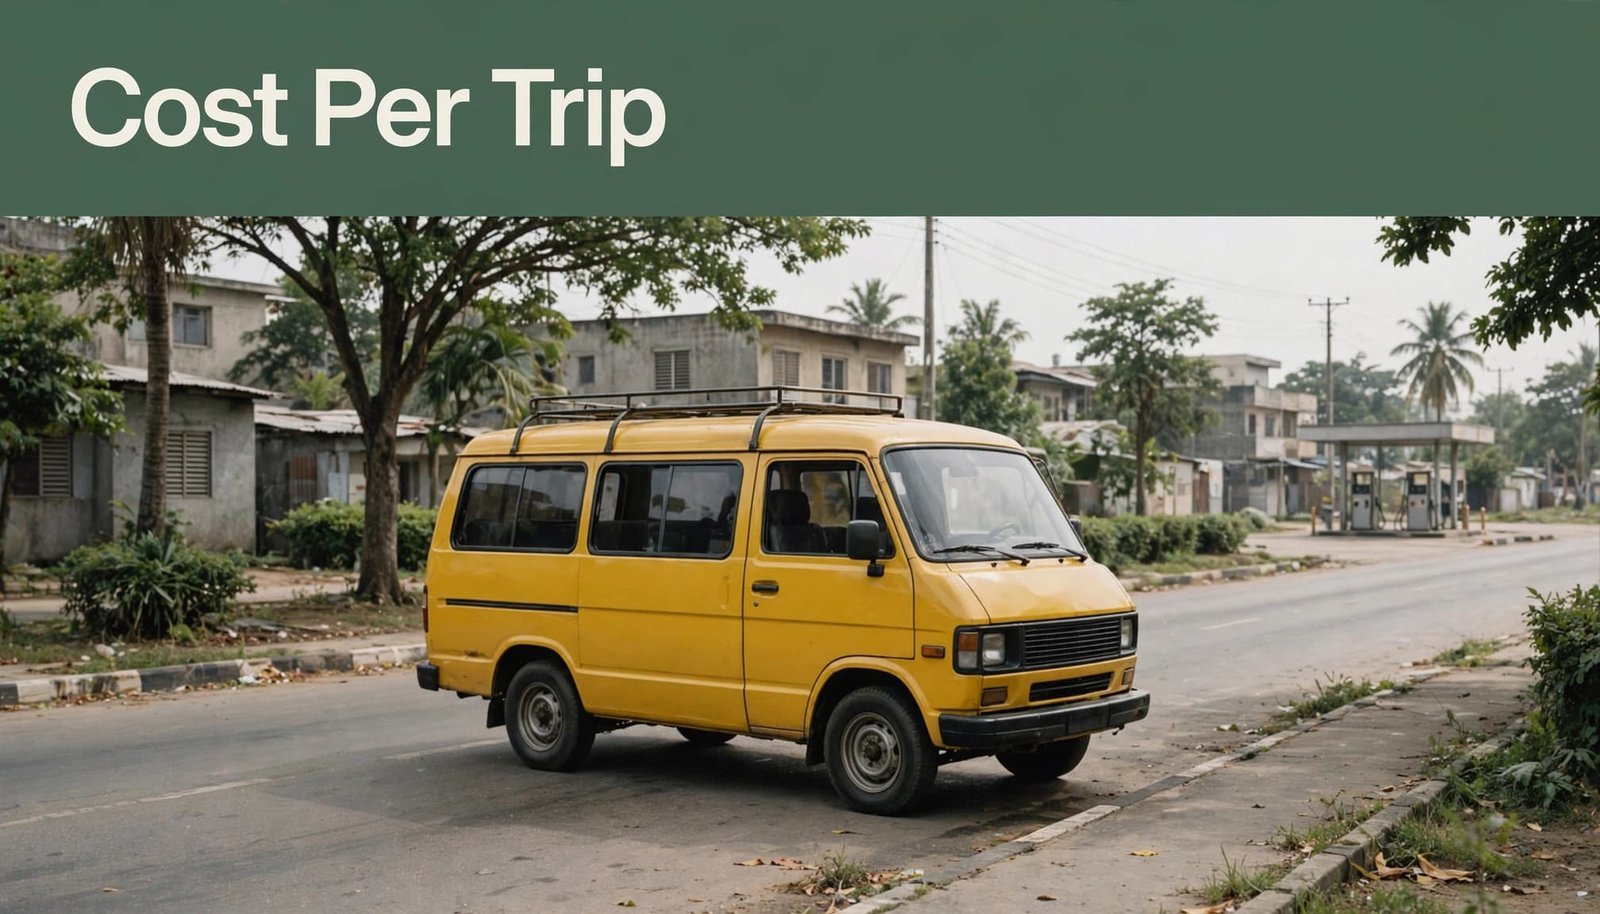
Monthly operating cost ÷ passenger trips = cost per passenger trip
Set out which costs you included. Fuel or energy, driver and crew pay, maintenance, tires, insurance, terminal costs, and vehicle leases can all affect the result. If a cost category is missing, say so. A partial estimate should not look like a full accounting.
Keep the cost period and ridership period aligned. Comparing a full month’s expenses with a partial passenger count will distort the result. If a bus was out of service for part of the month, record that too. The cost of maintaining an idle vehicle can still affect the operator’s monthly figures, even though it served fewer passengers.
A higher cost per trip doesn’t always mean a service is inefficient. Low demand, a short operating month, vehicle repairs, a route extension, or a one-time expense may explain the change. Compare the same route and mode over time, then check whether the service, cost rules, or passenger count changed.
Fare revenue is a separate measure. It depends on the service’s fare rules, discounts, payment channels, and fare collection. Regulated bus fares follow published route structures, while informal bus fares, taxis, and ride-hailing use different pricing systems. Use the relevant operator or official source for current fares, and don’t use a general fare estimate as a substitute for actual revenue.
6. Reported Crashes and Safety Outcomes
Keep a monthly record of reported crashes and safety events for the routes or services you cover. Separate crashes from breakdowns, passenger injuries, near misses, and service interruptions. These events have different meanings, and combining them into one total makes the result hard to use.
Report both the count and a denominator where possible. For example, you can compare crash reports with vehicle-kilometers traveled or completed trips. A raw monthly count may rise because the service operated more often, the reporting process improved, or the route changed. A rate gives readers a better basis for comparison, as long as the denominator is reliable.
Use clear language about where the data came from. An operator log, police report, FRSC report, and media account may record different events or use different definitions. Don’t combine their figures without checking how they define and count a crash. The FRSC Statistical Digest publishes reports by period. Check the date and definitions in each report before comparing one quarter with another.
Safety reporting should protect people. Share useful totals and trends, but don’t publish passenger names, phone numbers, or details that could identify someone involved in an incident. If a report is incomplete, say that it covers reported events only.
7. Transport Price Indicators and Data Coverage
Track transport prices with a clear label for the fare type, route, provider, and date. Regulated BRT and standard bus fares, informal bus fares, taxi prices, and ride-hailing quotes don’t follow one pricing system. A monthly table should keep them separate rather than suggesting that Lagos has one standard fare.
For regulated services, record the exact route and fare schedule date. For app-based trips, save the quote time, pickup point, destination, and service type, since traffic and demand can change the price. For an informal bus or taxi fare, note where and when you checked it and whether the price was agreed before boarding. Older prices can still help explain a trend, but they shouldn’t be presented as current without a fresh check.
Broader price indicators can add context, but they aren’t a direct measure of Lagos fares. National fuel-price and inflation data may help you understand cost pressures, yet they don’t tell you what a particular passenger paid on a specific route. The National Bureau of Statistics e-library is a place to check published price releases. Confirm the report period and geographic coverage before using a figure.
Your monthly report should also show the limits of the dataset. Include the routes, operators, terminals, modes, dates, and number of observations covered. List gaps plainly. If your figures cover one ferry route, one BRT corridor, or a sample of ride-hailing trips, name that coverage instead of calling it a Lagos-wide result. The Lagos transportation guide gives readers a broader view of the city’s different transport options.
Conclusion
A useful monthly transport report starts with seven questions: how many people boarded, how much service ran, whether trips stayed on time, how full vehicles were, what each passenger trip cost, what safety events were reported, and how prices changed. Give every number a clear definition, period, route, and source.
Keep operator or route data separate from citywide claims, and explain missing information. Once you do that consistently, you can compare months, spot real changes, and make better transport decisions across Lagos.



Leave a Reply